

What goes into one
seven sourcesread-only, every one
A monthly report is not an export. It is seven sources read, reconciled against each other, and argued into one page — including the ones that disagree, because where they disagree is usually the finding.
Analytics
Traffic, engagement, channels, geography, landing pages, funnels, cohorts and the events the property actually counts as a result.
Search Console
Clicks, impressions, position and coverage — by query, page, country and device, taken from final data rather than the fresh figures that later move.
PageSpeed
Lab performance and the ranked list of fixes, with the time each one would actually save.
Chrome UX Report
What real visitors experienced, not a simulation — the field data Google itself uses, trended over months.
The site itself
Fetched as any visitor fetches it. Is the tag on the page, what does the sitemap contain, where
do the redirects lead, what does robots.txt permit.
The edge
Every request actually served, counted in front of the site — before an ad blocker, a consent banner or a broken tag could remove it from Analytics.
The Knowledge Graph
What Google publicly holds about the business as an entity: the name, the description and the address it treats as official.
Business Profile
Local reporting, where a client asks for it and grants it: listing performance, the searches that produced it, and reviews. Not read unless it is asked for.
What most reporting leaves out
the difficult figuresstated, not omitted
Every platform has numbers it would rather you did not examine. Those are the ones worth printing, and a report that omits them is easier to write and worth less to read.
The search Google will not itemise
Search Console names a query only when enough different people searched it. Everything below that threshold is counted in your totals and never named — on a smaller site it is most of the month.
Most reports quietly present the named queries as though they were the whole. We print the gap as a figure, so a query table is read as the shape of demand and never as its size.
What Analytics never saw
Analytics counts browsers that ran a script. The edge counts requests that were served. The difference between them is the share of a site Analytics is blind to, and it is never zero.
We measure both and report the gap. A gap that is large is normal. A gap that suddenly widens is a tag that stopped firing — and that failure is indistinguishable from a quiet month if you only look at one of the two.
History Google deletes
Search Console keeps sixteen months. Analytics keeps whatever a property is set to, and the shortest setting is two months — which is what we have found in the wild more than once.
Every figure we publish is pinned as it was read, on the day it was read. Our record outlives Google's, so a comparison next year is against what was actually reported rather than whatever the API says by then.
Nothing modelled, nothing estimated
No blended numbers, no projections, no smoothing. Where a figure cannot be known it is stated as unavailable rather than shown as a zero — because a zero is a measurement and an absence is not.
Where a metric measures nothing useful, the report says so. A conversion count of zero on a property that cannot fire a conversion is accurate and meaningless, and the page will tell you which it is.
Every figure carries its source
provenance on the pagearguable by design
Each plate names the property, the exact date range, and the call that produced the numbers on it. Any figure in the report can be traced back and disputed — which is the only reason to trust one.
Where it came from
Property, date range and query printed beside the plate, not buried in a methodology note nobody reads.
What it excludes
Thresholds, withheld rows, the grouped long tail, and any window where the data was not final.
When it changed
A report reissued after you have read it carries the date, a version, and a statement of what moved — on its face, not in an email.
Watched every day, not once a month
thirteen checkseach with a number behind it
A monthly report describes a month that has already happened. Most of what goes wrong is worth knowing the same week — so every client is checked every day, and the report is what is left over after the checks have already caught the rest.
Is it still being measured
The tag on the page, and the served traffic compared against the recorded traffic. This is the failure that costs months of history before anyone notices.
Is it still being found
Traffic and search against the prior week, average position, robots.txt, and
whether Google is still reading the sitemaps it was given.
Is it counting the right thing
Whether anything is marked as a result at all, and whether the property is about to start deleting its own history.
What is worth taking
Demand already ranking just below the point where people click — the cheapest ground on any site, and the work the next month goes into.
Every check has a threshold and states it. Anything that does not cross one is not reported, because a report that cries wolf is one nobody reads twice.
Finding your report
private addressone report, one link
Reports are not listed here and never will be. Each one is published to an address nobody can arrive at by guessing, and sent to the people it was written for.
You need the direct link
Your link looks like /<your-name>/transit-014-… and arrives by Slack or
email from your MoonFactory contact.
Opening it asks for your email address and sends you a one-time code. There is no password to keep, and nothing to share — access belongs to you rather than to the link. If your address is not recognised, reply to the thread that sent you the report and we will add it.
There is nothing to find here
This is infrastructure, not a public site. Nothing on this host is indexed, and no report opens for anyone whose email address has not been given access to it.
The company itself is at moonfactory.dev.
The series
two documentsnumbered, dated, kept
Two kinds of report, each numbered and dated. Every issue we have ever sent stays at the address it was sent to, so a figure can be checked against the page it was first published on.
A specimen issue
invented figuresno client shown
Every report is one page, cut for one client and one month. It states the property, the exact date ranges, and the query behind every figure — so any number on it can be argued with rather than taken on trust.
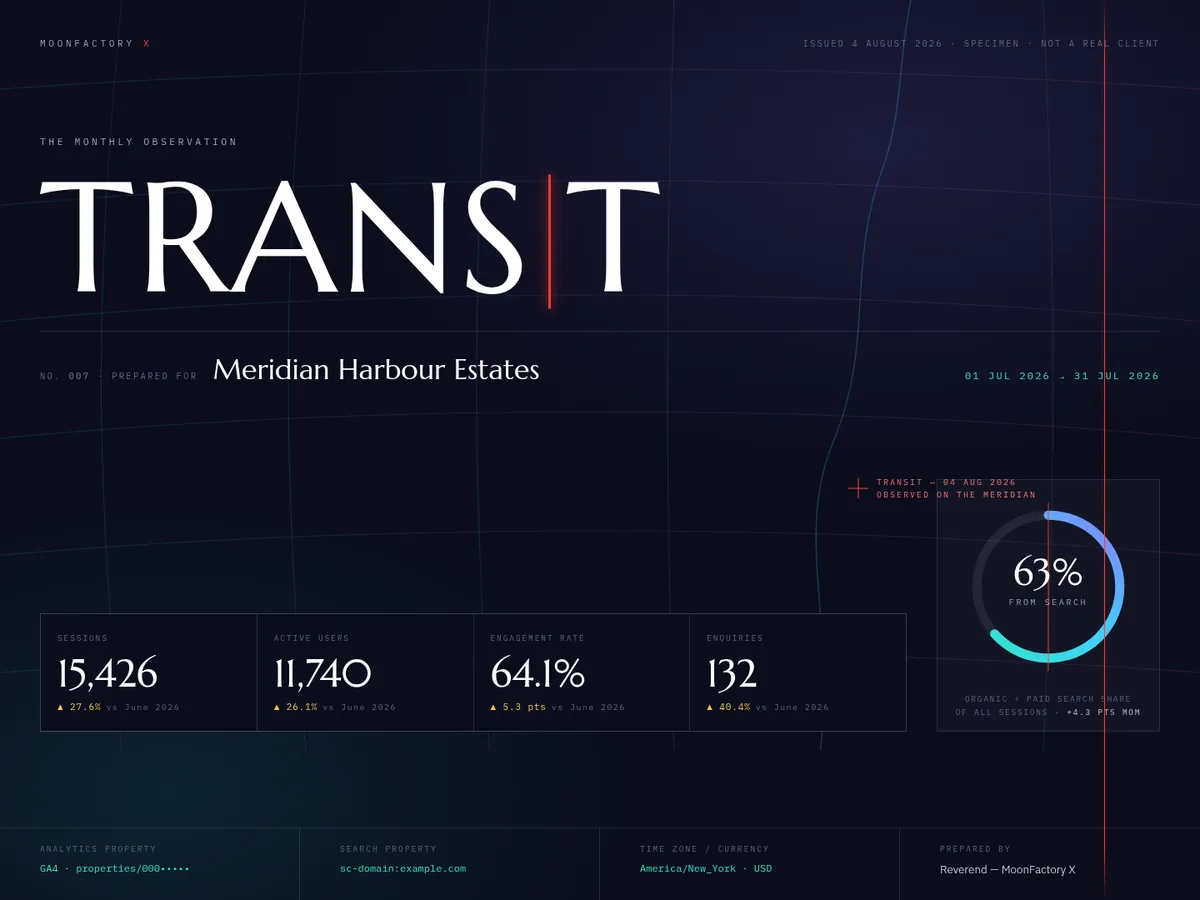
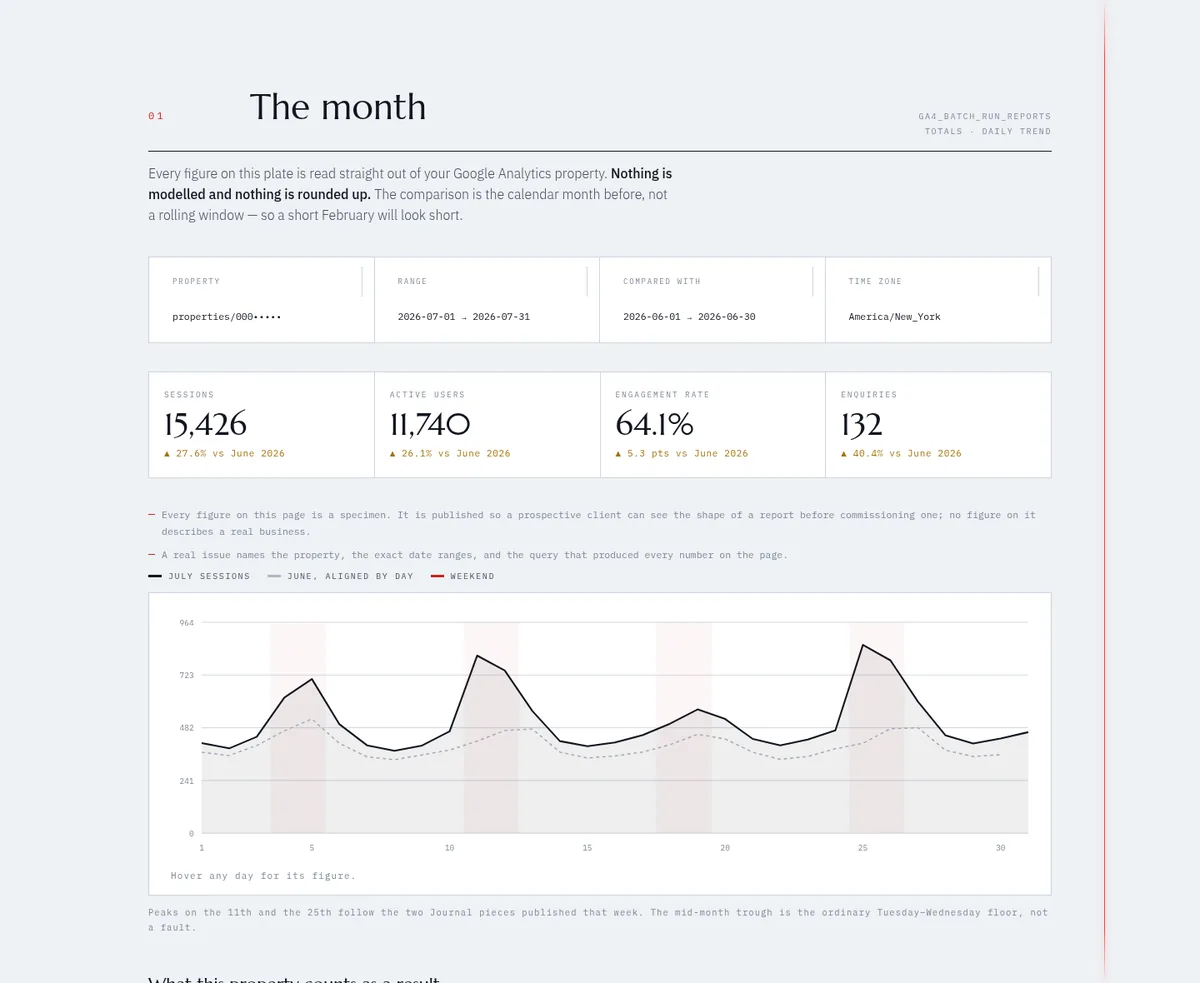
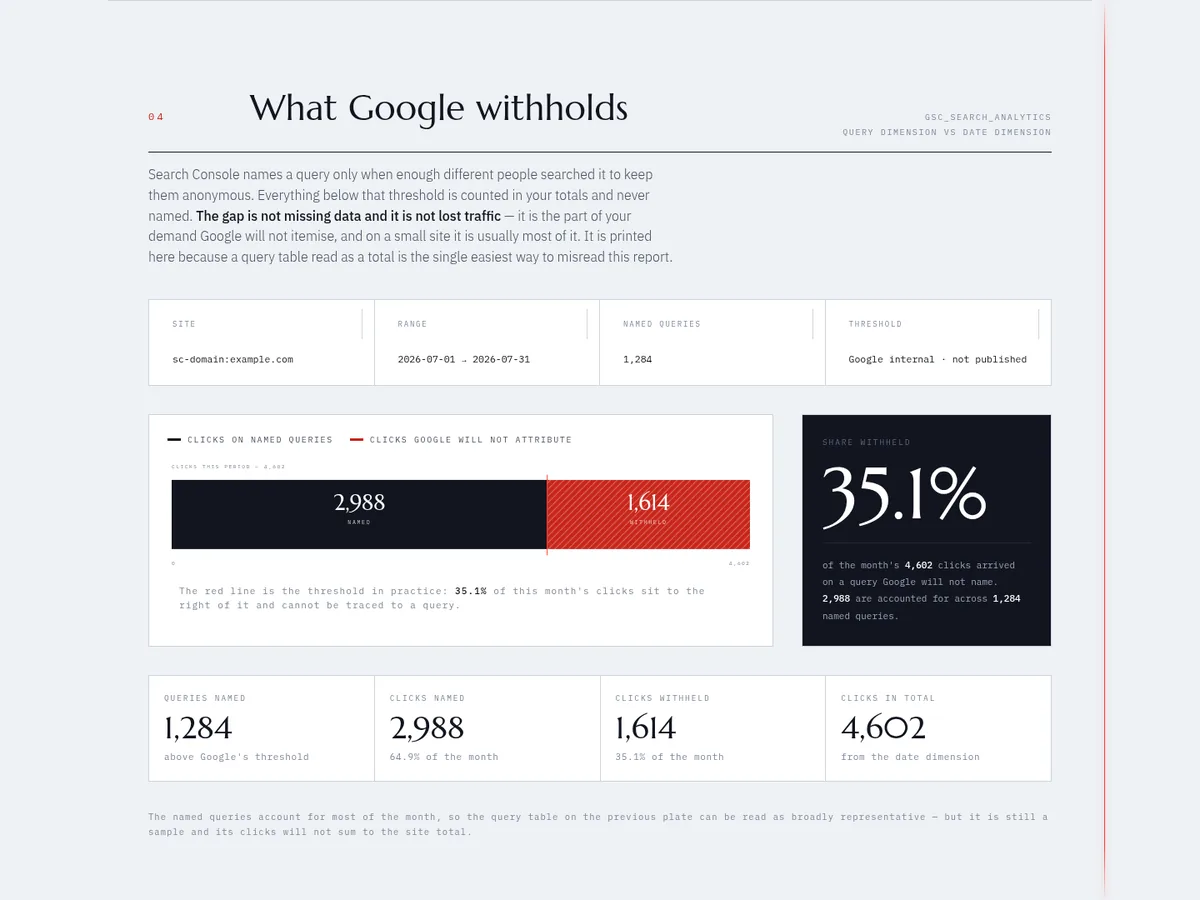
Specimen. Meridian Harbour Estates is not a real client and every figure above is invented. No client's data appears on this page.
What this application reads
read-onlygranted and withdrawn by the client
MoonFactory X builds these reports from data held in each client's own Google accounts, with that client's permission. The application requests read-only access to Google Analytics and Search Console, and — where a client asks for it — access to their Google Business Profile.
It reads. It does not write. The application cannot publish, edit a listing, reply to or delete a review, submit a sitemap, request indexing, or alter a setting in any connected account. Access is granted by the client and can be withdrawn by the client at any time.
Questions about what is collected and how it is held: rev@moonfactory.dev.